
Meteorological Charts
WAFS Significant Weather Charts
- WAFS Significant Weather (SIGWX) Charts are issued by the World Area Forecast Centres (WAFC) in London and Washington.
- Chart documentation provided for international flights includes:
- Significant Weather (SIGWX) Charts
- Wind Forecast Charts
- Temperature Forecast Charts
- SIGWX charts are generated from WAFC forecasts for flight levels between FL250 and FL630.
- Wind and temperature forecast charts are prepared for the 250 hPa pressure level.
- Chart documentation for national flights includes:
- National Significant Weather Charts
- WAFC Upper Wind and Temperature Charts for:
- 600 m (2,000 ft)
- 1,500 m (5,000 ft)
- 3,000 m (10,000 ft)
WAFC Chart Validity and Coverage
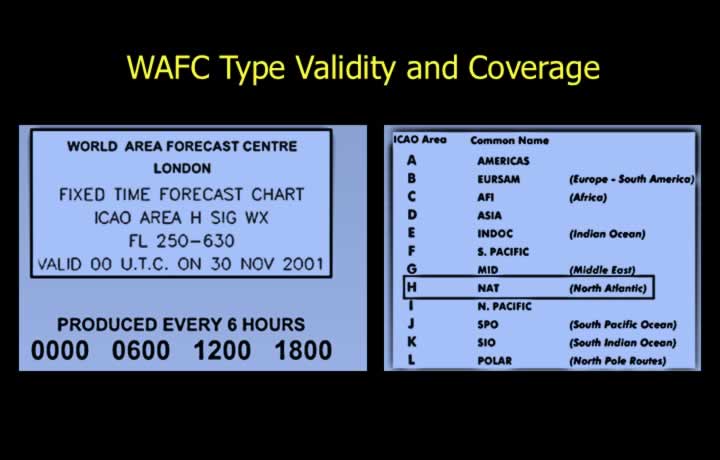
- High-Level WAFC charts are issued every 6 hours for flight levels FL250–FL630.
- Medium-Level WAFC charts are issued every 6 hours for flight levels FL100–FL450.
- WAFC charts cover the entire globe and are identified using ICAO area codes.
WAFC Significant Weather Information
WAFC Significant Weather (SIGWX) charts include the following information:
- Thunderstorms
- Embedded Cumulonimbus (CB) and significant clouding
- Tropical Cyclones
- Moderate and Severe Turbulence
- Clear Air Turbulence (CAT)
- Moderate and Severe Icing
- Widespread Sand and Dust Storms
- Frontal Zones and Inter Tropical Convergence Zone (ITCZ)
- Significant Tropopause Flight Levels
- Jet Streams
- Volcanic Ash
Thunderstorms
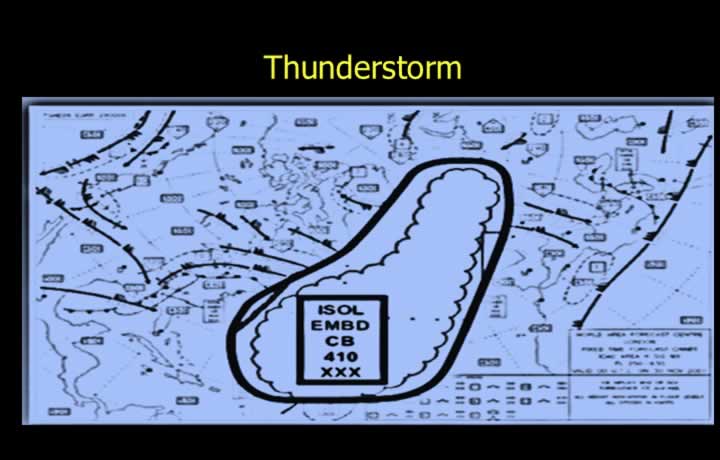
- Embedded CB clouds and thunderstorms are shown using curved lines.
Significant Clouds
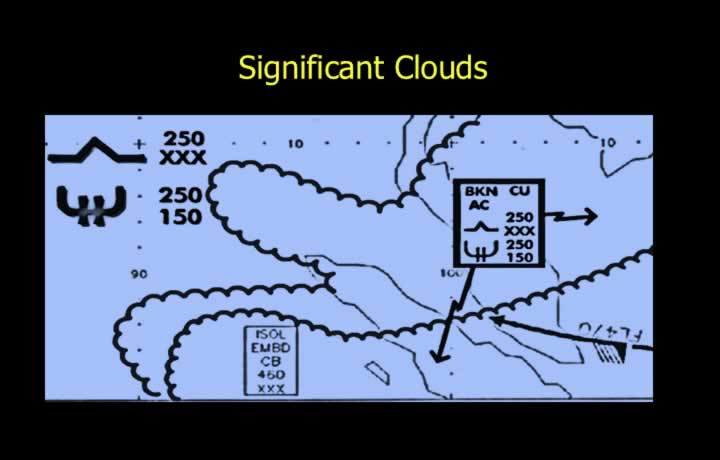
- Medium and high clouds are depicted along with associated aviation hazards.
Tropical Cyclones
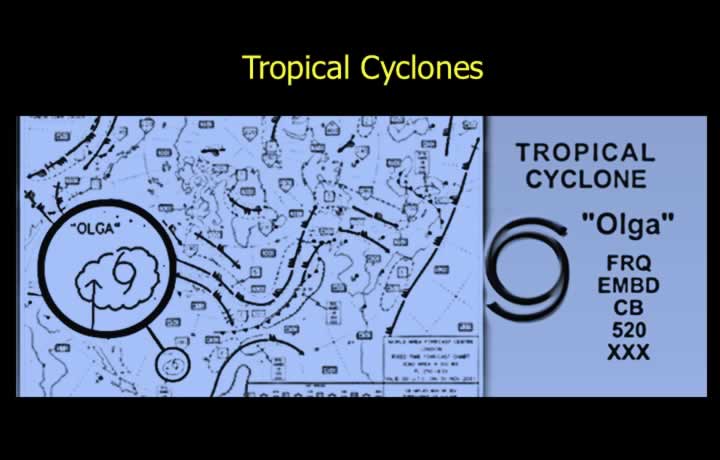
- Tropical cyclones are shown on the chart along with their names.
Severe Turbulence
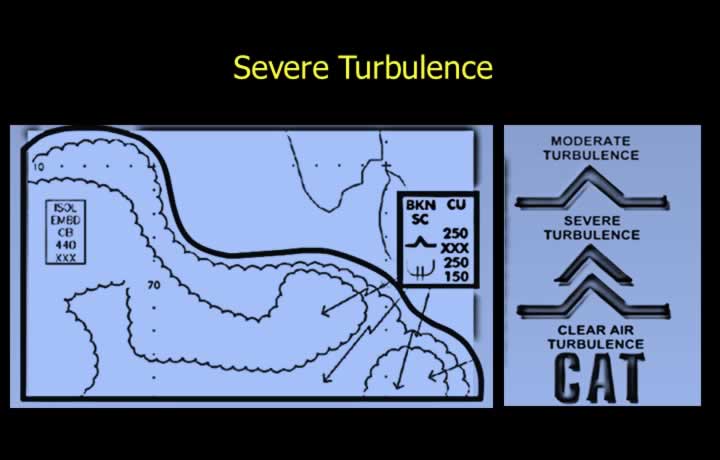
- Areas and flight levels affected by severe turbulence are marked.
Clear Air Turbulence (CAT)
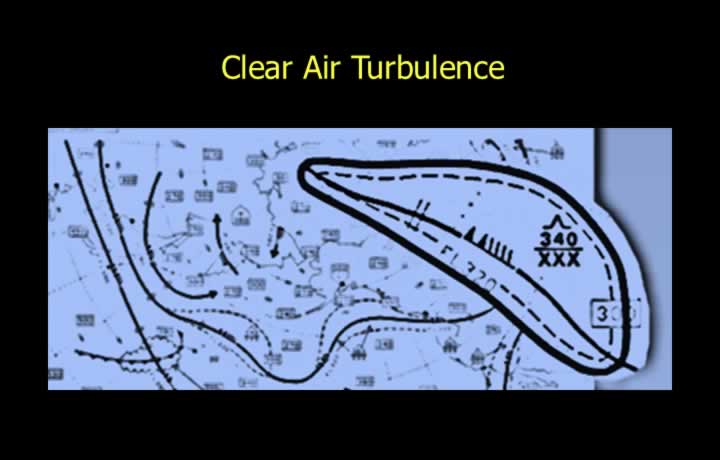
- CAT areas and flight levels are indicated along with wind speeds in knots.
Aircraft Icing
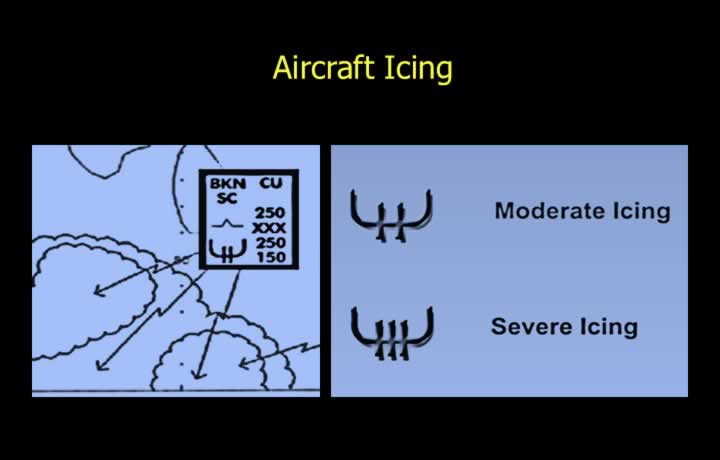
- Moderate and severe icing areas are identified using standard chart symbols.
Convergence Zones
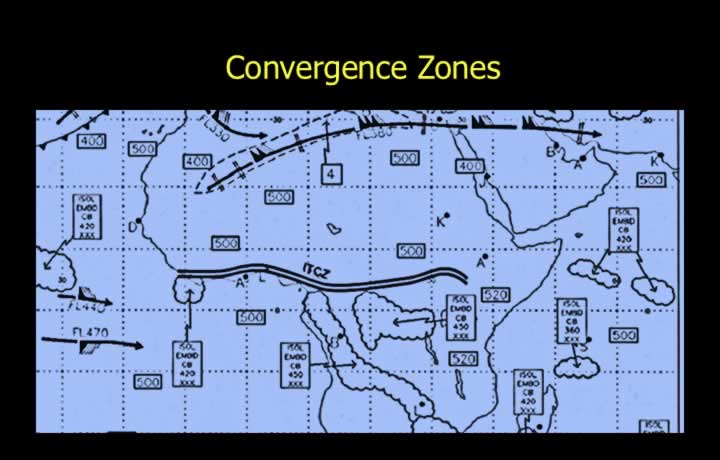
- Convergence zones such as the Inter Tropical Convergence Zone (ITCZ) are marked.
- Cloud development is generally expected within convergence zones.
Tropopause Heights
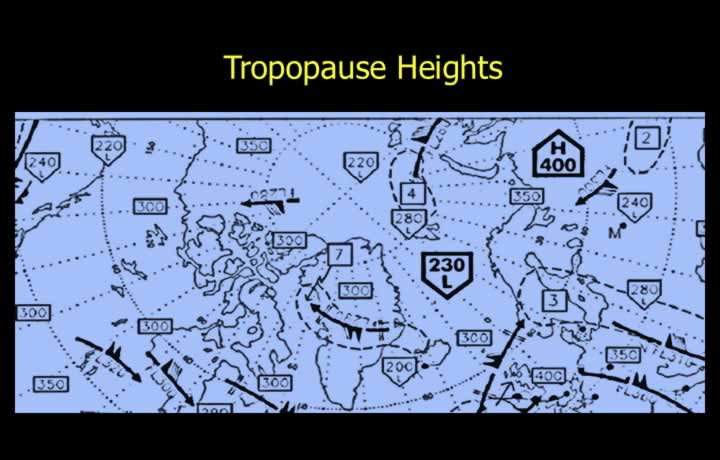
- Tropopause heights are shown on the charts.
- Jet streams are generally expected near the tropopause.
Jet Streams
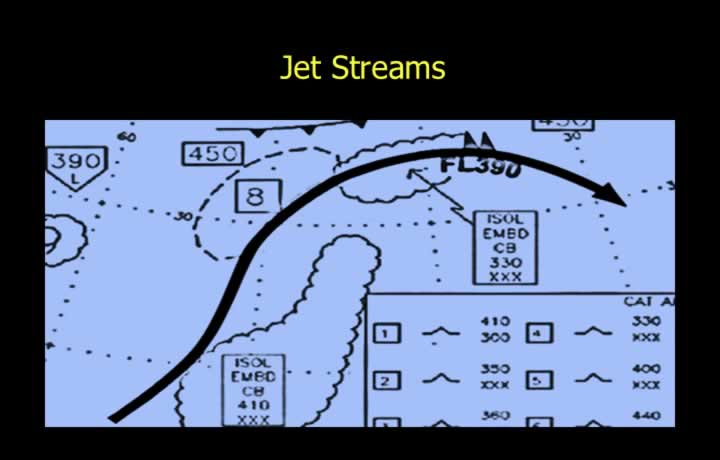
- The presence and location of jet streams are indicated.
Volcanic Ash
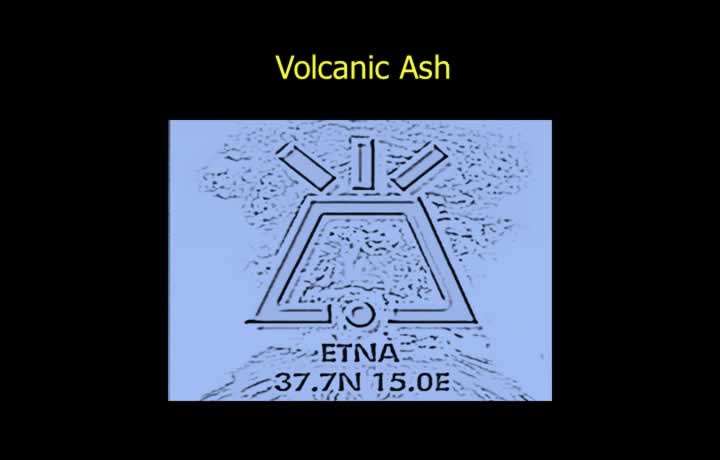
- Areas affected by active volcanic ash from erupting volcanoes are shown.
National Significant Weather Charts
- National Significant Weather (SIGWX) Charts are prepared four times daily at:
- 0000 UTC
- 0600 UTC
- 1200 UTC
- 1800 UTC
- Prepared by Meteorological Watch Offices (MWO) for their respective Flight Information Regions (FIR).
- Compiled and distributed by MWO Chennai.
- SIGWX charts may be valid for 9 hours or 24 hours from the time of issue.
- Medium-Level Charts cover FL100–FL250.
- High-Level Charts cover FL250–FL630.
Contents of National SIGWX Charts
- Tropical Cyclones with wind speeds greater than 34 knots.
- CB clouds associated with:
- Thunderstorms (TS)
- Tropical Cyclones (TC)
- Line Squalls
- Hail
- Moderate or Severe Icing
- Turbulence
- Clear Air Turbulence (CAT)
- Marked Mountain Waves
- Widespread Sand or Dust Storms
- Freezing Level and Tropopause Height.
- Location of volcanic eruptions or radioactive material release.
- Jet Streams.
Local Forecast Chart
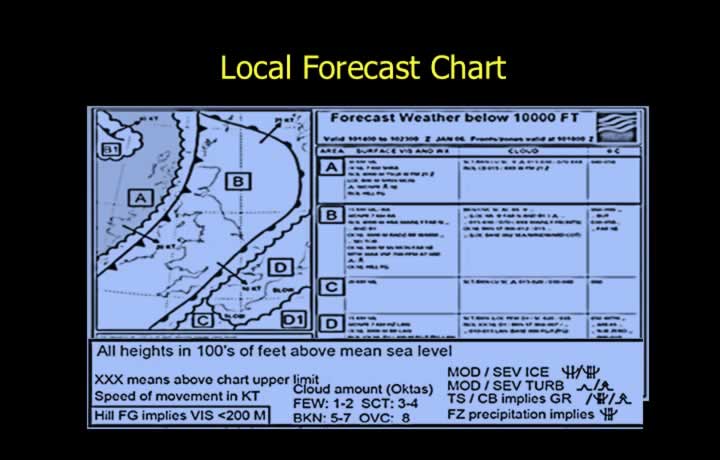
- Forecast zones are identified using alphabetic labels.
- Weather within each zone is described in plain language.
- Frontal boundaries, direction (using arrows), and movement speed (knots) are indicated.
- Weather phenomena are represented using meteorological symbols.
Local Forecast – Weather Information
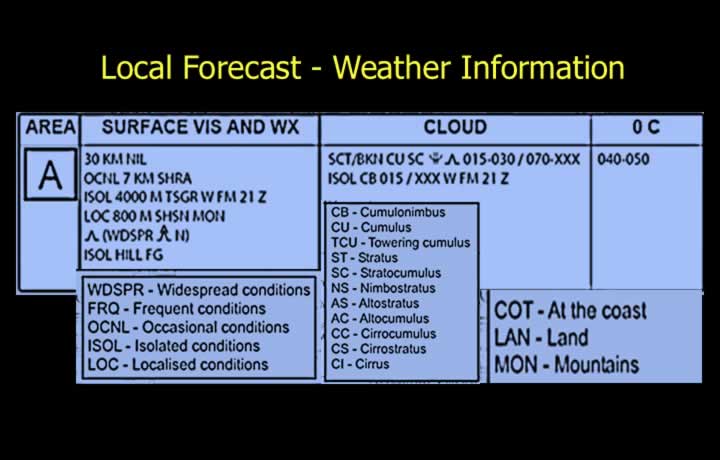
- Weather information includes:
- Surface Wind
- Visibility
- Clouds
- 0°C Isotherm
- Information is presented in abbreviated meteorological format.
Weather Codes
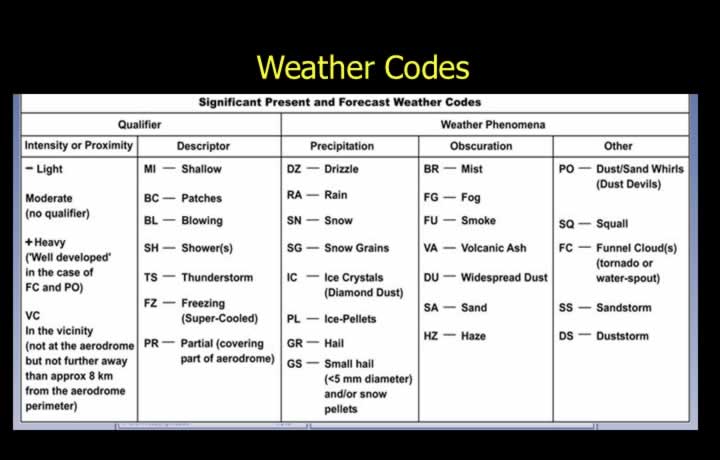
Weather codes used are similar to those used in METAR reports.
Example – Surface Winds and Weather
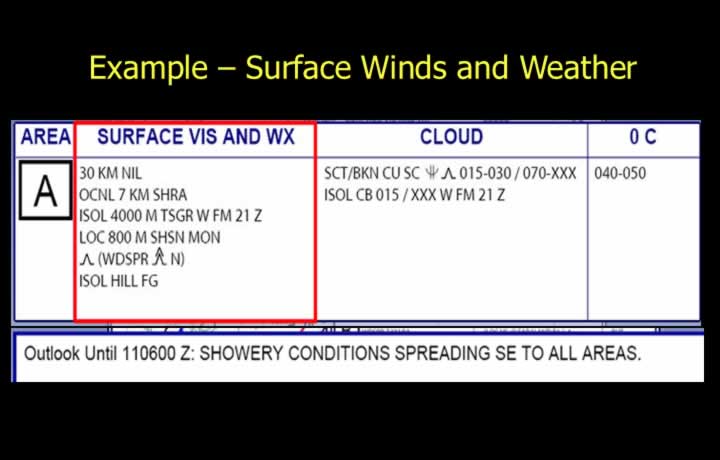
Zone A:
- Generally no significant weather.
- Visibility generally 30 km.
- Occasionally reduced to 7 km in rain showers.
- Isolated areas with visibility of 4,000 m.
- Thunderstorms and hail expected in the western part of the zone from 2100 UTC.
- Locally 800 m visibility in moderate snow showers over mountainous areas.
- Moderate turbulence with widespread severe turbulence to the north.
- Isolated hill fog reducing visibility below 200 m.
Example – Clouds and Outlook
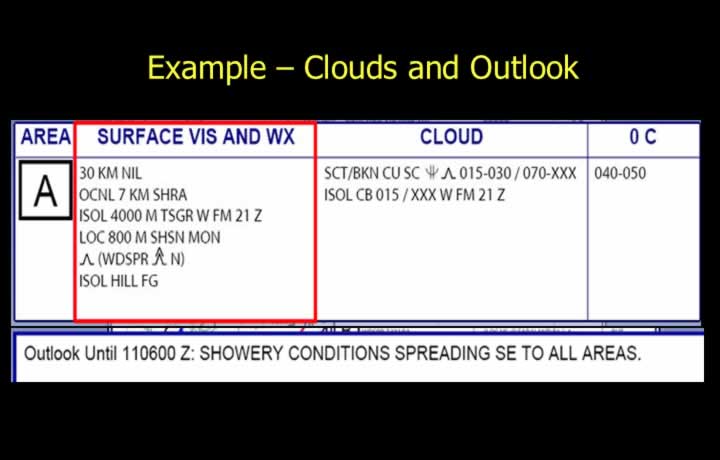
- Generally scattered (SCT) or broken (BKN) Cumulus (CU) and Stratocumulus (SC).
- Moderate icing and turbulence expected.
- Cloud bases between 1,500 and 3,000 ft.
- Cloud tops from 7,000 ft to above 10,000 ft.
- Isolated CB clouds with bases from 1,500 ft and tops above 10,000 ft after 2100 UTC.
- 0°C Isotherm between 4,000 and 5,000 ft (expressed in hundreds of feet).
- Outlook until 11th – 0600 UTC: Showers spreading from the southeast to all areas.
Prognosis Chart
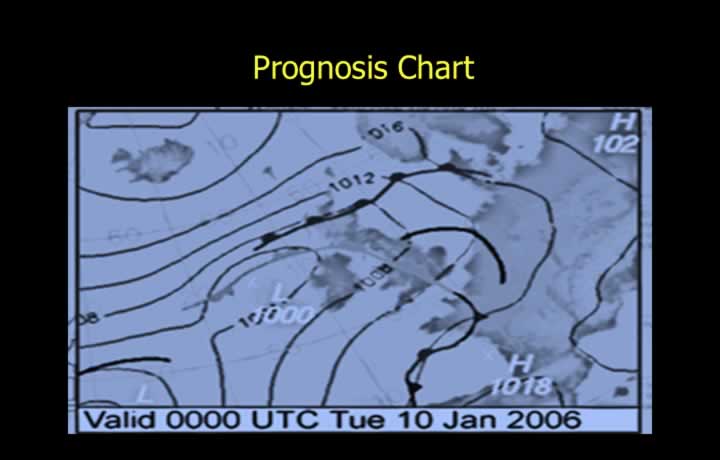
- Prognosis charts become effective for 6 hours after the validity period of the main chart.
- They show the expected future position of the weather systems depicted on the main chart.
Spot Wind Chart
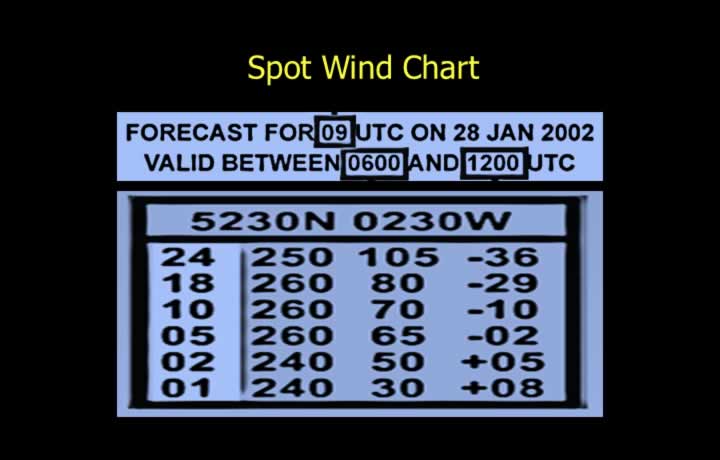
- Spot Wind Charts are issued four times daily.
- Each chart is valid for 6 hours.
- Charts provide:
- Altitude
- True Wind Direction
- Wind Speed (knots)
- Temperature (°C)
- Used for route wind calculations during flight planning.