
Radar and Satellite Reports
Types of Weather Radar
- Ground weather radars are classified according to their function.
- Quantitative Radars (10 cm): Measure the intensity and rate of precipitation.
- Ultra-Sensitive Radars: Detect cloud convection and study Clear Air Turbulence (CAT), gravity waves and lee waves.
- Plan Position Indicator (PPI): Displays weather echoes in plan view using range and bearing.
- Range Height Indicator (RHI): Displays the altitude or vertical profile of weather echoes such as Cumulonimbus (CB) cells.
- Doppler Weather Radar (DWR): Uses the Doppler principle to detect and forecast thunderstorms, tornadoes, heavy rainfall, dust storms and sandstorms.
- Doppler radars estimate wind velocity and help predict wind shear, turbulence and Clear Air Turbulence (CAT).
- They can also detect gust fronts, micro-bursts, downbursts and tornadoes.
Indian Weather Radars
- The Indian Integrated Upper Air Sounding System (IIUASS) is an indigenous X-band weather and wind-finding multi-meteorological radar system.
- The Radiosonde network consists of:
- 14 S-band (10 cm) radars.
- 25 Digital X-band (3 cm) radars.
- 5 Doppler Weather Radars (DWR).
- The system has a usable range of approximately 200 km and a maximum range of 400 km.
- Operational weather monitoring is generally carried out between 25 NM and 75 NM.
Weather Radar Echoes
- Cloud Echoes:
- Stratiform clouds produce diffuse echoes with a bright band caused by melting ice crystals or snowflakes.
- Convective clouds produce sharp-edged echoes. Blurred edges indicate weakening clouds.
- A line of echoes generally indicates a squall line.
- Strong echoes with high tops indicate Cumulonimbus (CB) clouds.
- Severe storms produce intense, sharply defined echoes due to large supercooled water droplets.
- Hook-shaped or appendage echoes indicate violent storms.
- A figure-six pattern, dry holes, rapid development, broad horizontal echoes and converging echoes are associated with tornadoes.
- Weak storms may appear as a bright band.
Airborne Weather Radar (AWR)
- Airborne Weather Radars are generally X-band (3 cm) radars designed to detect large water droplets in clouds.
- The radar scans using a conical beam covering approximately 70° on either side of the aircraft.
- Modern radars are multimode, digital, lightweight and support:
- Weather detection.
- Ground mapping.
- Transponder operations.
Colour Codes in Airborne Weather Radar
- Red: Heavy precipitation, thunderstorms, hail, strong winds, tornadoes, severe turbulence and rainfall greater than 12 mm/hr.
- Yellow: Moderate precipitation, reduced visibility, moderate turbulence and rainfall between 4–12 mm/hr.
- Green: Light precipitation, slight turbulence, reduced visibility and rainfall between 1–4 mm/hr.
Example of Radar Report (RAREP)
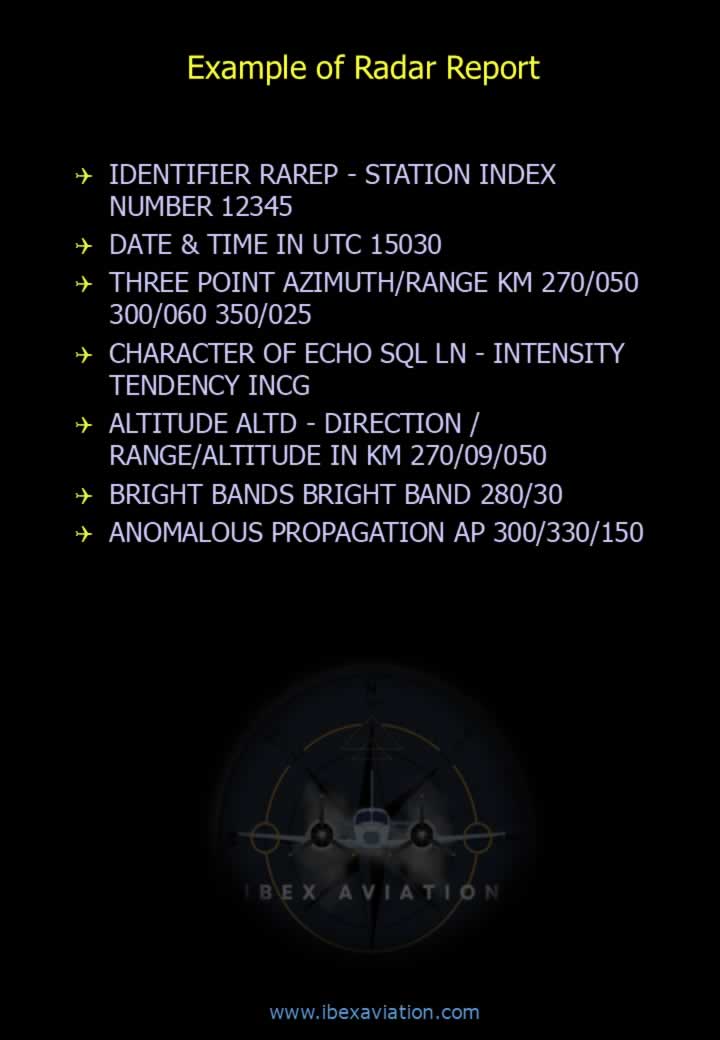
IDENTIFIER              RAREP
STATION INDEX NUMBER    12345
DATE & TIME (UTC)       15030
AZIMUTH/RANGE (KM)      270/050 300/060 350/025
ECHO CHARACTER          SQL LN
INTENSITY TREND         INCG
ALTITUDE                ALTD
DIRECTION/RANGE/ALT     270/09/050
BRIGHT BAND             280/30
ANOMALOUS PROPAGATION   AP 300/330/150
Types of Meteorological Satellites
- Polar-Orbiting Satellites:
- Orbit between 650 km and 1000 km.
- Cover the Earth twice every 24 hours.
- Pass over the same location approximately every 12 hours.
- Example: NOAA (K, L, M Series).
- Geostationary Satellites:
- Orbit at approximately 36,000 km above the Equator.
- Remain over the same geographical position because their orbital period matches Earth’s rotation.
- Examples:
- GOES (USA)
- EUMETSAT (Europe)
- Japanese Geostationary Satellite (130°E)
- INSAT (India)
- Five geostationary satellites are sufficient to provide nearly global coverage.
- Satellite imagery is generally updated every 3 hours.
- Indian Meteorological Satellites: KALPANA, INSAT-3D and METSAT.
- The India Meteorological Department (IMD) also receives meteorological data from NOAA, MODIS (USA) and OCEANSAT.
Satellite Imagery
- Satellite imagery is analysed using:
- Brightness.
- Texture.
- Pattern.
- Shape.
- Structure.
- Size.
- Radiometers onboard satellites measure:
- Radiation.
- Cloud-top temperature.
- Earth’s surface temperature.
- These measurements are processed to generate information on:
- Vertical temperature profile.
- Humidity.
- Cloud-top height.
- Sea surface temperature.
- Upper winds.
- Convective clouds.
- Mesoscale weather systems.
Example of Satellite Bulletin
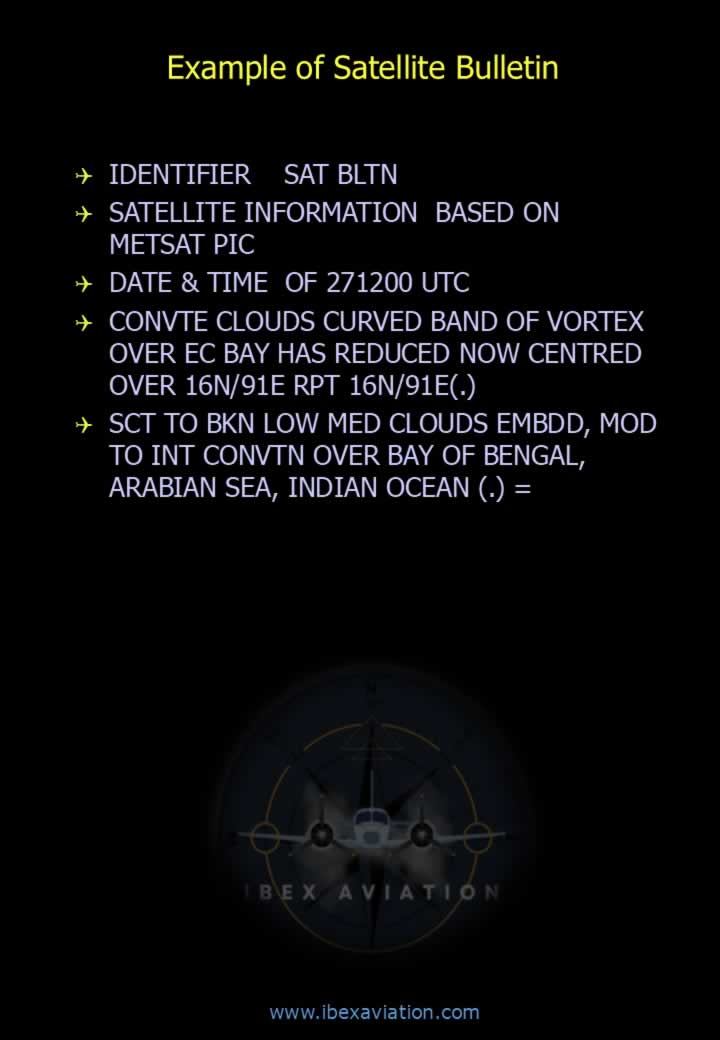
IDENTIFIER              SAT BLTN
SATELLITE INFORMATION   BASED ON METSAT PIC
DATE & TIME             271200 UTC
CONVECTIVE CLOUDS       CURVED BAND OF VORTEX OVER EC BAY HAS REDUCED,
                        NOW CENTRED OVER 16N/91E RPT 16N/91E
LOW/MEDIUM CLOUDS       SCT TO BKN LOW/MED CLOUDS,
                        EMBDD MOD TO INT CONVECTION OVER
                        BAY OF BENGAL, ARABIAN SEA,
                        INDIAN OCEAN =