Ideal Projections
Map and chart projections are methods used to represent the curved surface of the Earth on a flat chart. They help pilots accurately display positions, distances, and directions for navigation. Common projections include Mercator, Lambert Conformal Conic, and Polar projections. Each projection has advantages and limitations depending on the area and purpose of use. Aviation charts use suitable projections to support safe and accurate flight planning.
Introduction to Projections
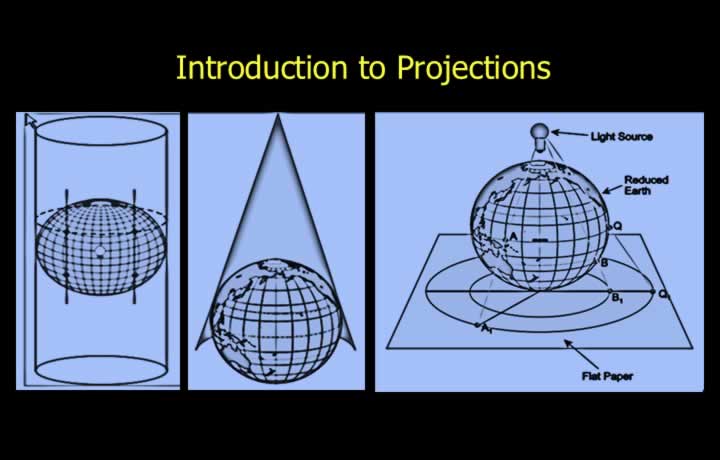
- Map projections are used to represent the spherical Earth on a flat surface.
- Traditionally, map preparation was carried out in three stages.
- A scaled three-dimensional model of the Earth, known as the Reduced Earth, was prepared.
- Light was projected from inside the Reduced Earth onto a sheet of paper wrapped around it.
- The wrapped paper was then cut and opened to display the graticule (network of latitudes and longitudes).
Perspective and Non-Perspective Projections
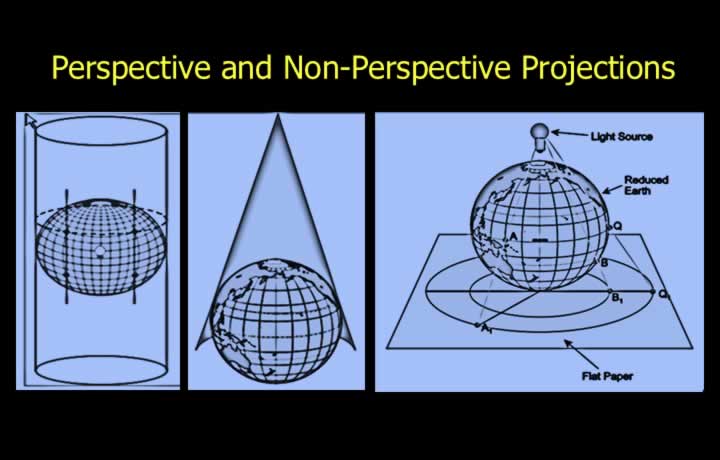
- Perspective projections are obtained directly using a light source.
- These projections are used without mathematical modification.
- Non-perspective projections are mathematically modified versions of perspective projections.
- Most practical map projections are non-perspective projections.
Orthomorphic (Conformal) Charts
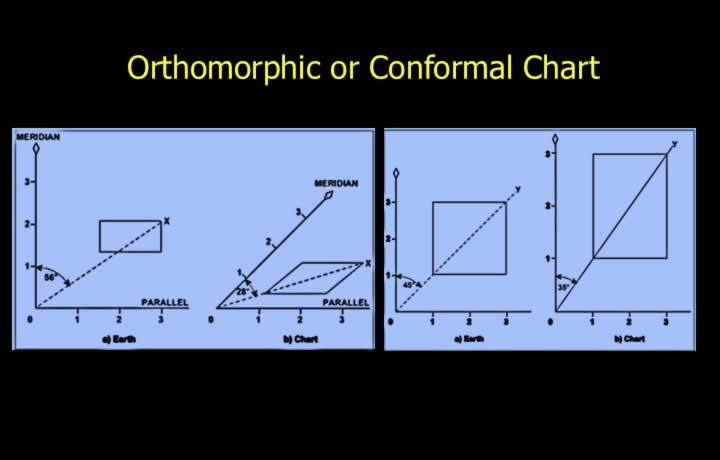
- Orthomorphic means that angles and bearings are preserved accurately.
- The terms orthomorphic and conformal have the same meaning.
- Aviation charts must be orthomorphic (conformal) for accurate navigation.
- A chart is orthomorphic only if the following conditions are satisfied:
- Meridians and parallels intersect at right angles.
- Scale is the same in every direction around any point.
- Scale expansion in the north-south and east-west directions is equal.
Correct Scale on a Chart
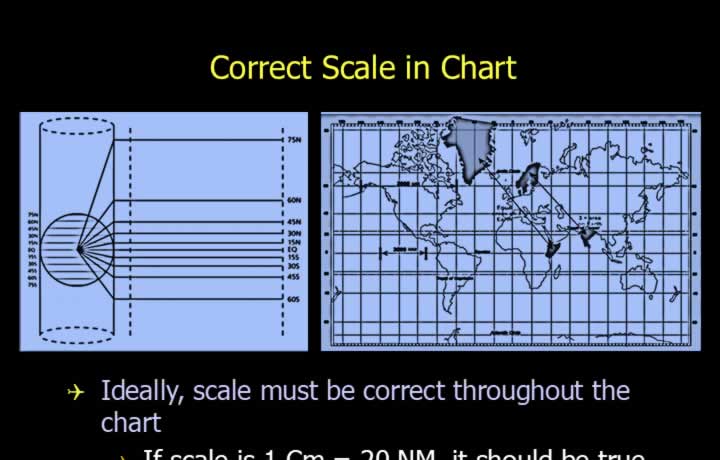
- Ideally, the scale should remain correct throughout the chart.
- For example, if the scale is 1 cm = 20 NM, it should be accurate everywhere.
- This is possible only if there is no scale expansion or contraction.
- Scale error is zero only where the projection surface touches the Reduced Earth.
- This point or line is called the parallel of tangency or origin.
- At other latitudes, light travels different distances, causing scale distortion.
- The ICAO considers a scale error of up to 1% acceptable.
Constant Scale
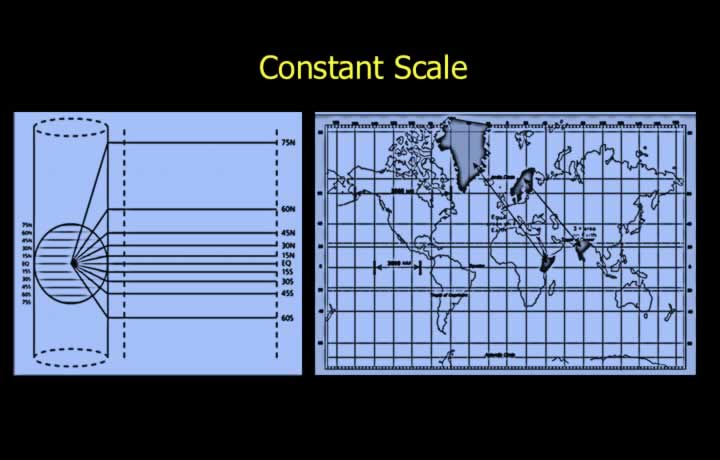
- In a constant-scale chart, the scale (e.g., 1:1,000,000) remains the same throughout.
- Because the Earth is spherical, a truly constant scale is impossible.
- East-west distances decrease as latitude increases.
Correct Scale vs. Constant Scale
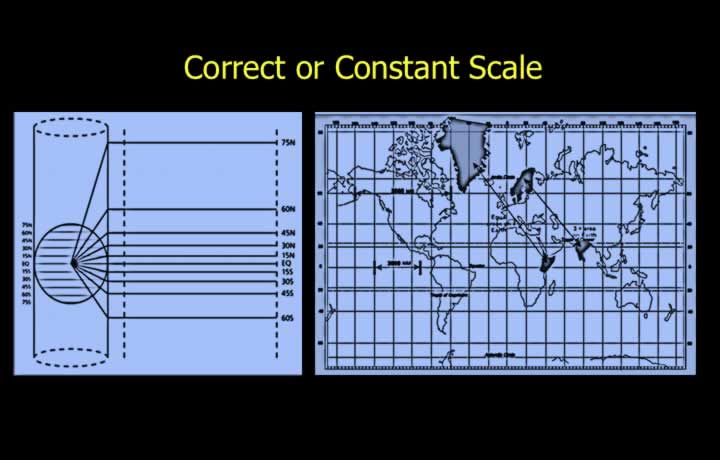
- Ideally, a chart should have both correct and constant scale.
- In practice, achieving both simultaneously is impossible.
- A projection cannot have scale that is both perfectly correct and perfectly constant everywhere.
Shapes of Features
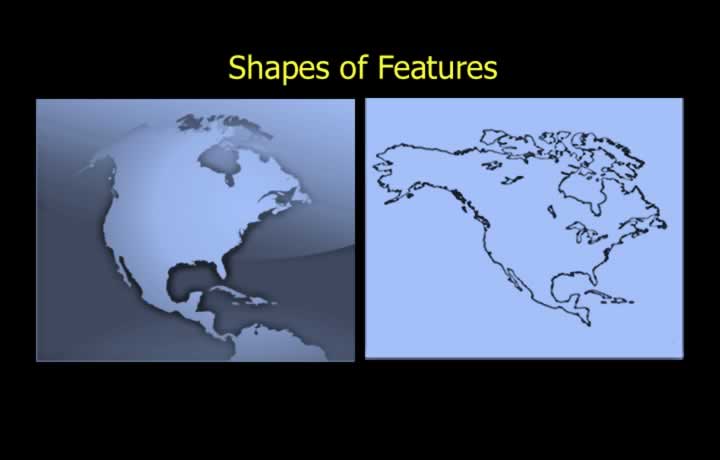
- Ideally, features should retain their true shapes.
- This would require latitudes and longitudes to remain as they are on the Earth’s surface.
- Such a projection would make plotting difficult because the graticule would not consist of straight lines.
- Shape distortion is acceptable in aviation because it has little effect on navigation.
Areas on the Map and Ground
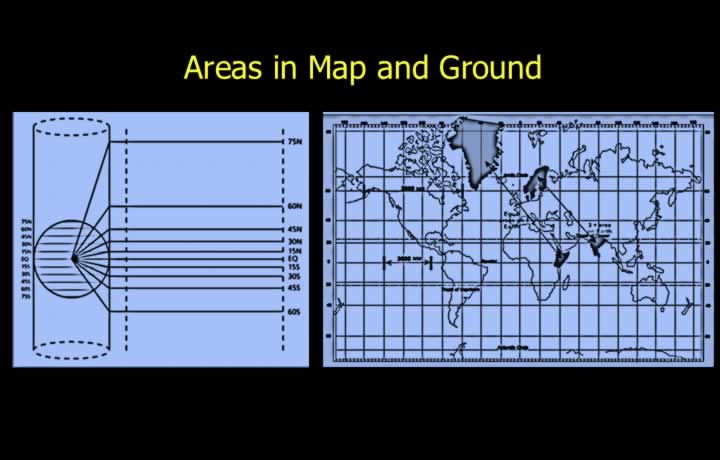
- Ideally, equal areas on Earth should appear as equal areas on the map.
- Equal-area projections maintain this property.
- For aviation, correct scale is more important than preserving area.
- Expansion or contraction of area has little effect on air navigation.
Great Circles and Rhumb Lines
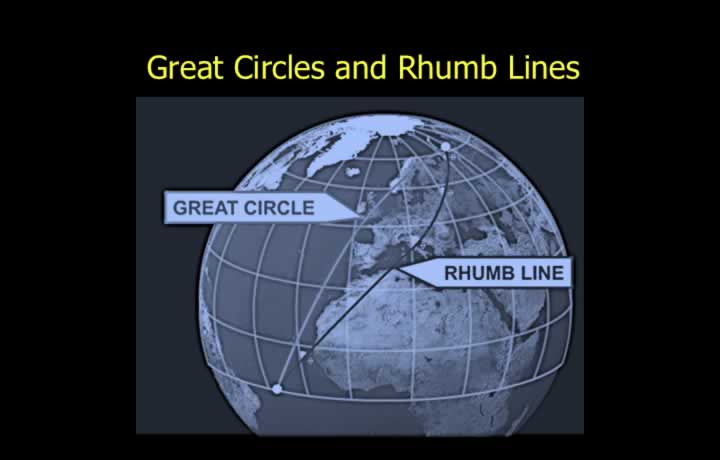
- Ideally, both great circles and rhumb lines should appear as straight lines.
- On the Earth, great circles represent the shortest path between two points.
- Rhumb lines cross all meridians at a constant angle.
- No map projection can show both great circles and rhumb lines as straight lines simultaneously.
- If one is represented as a straight line, the other must appear curved.
Latitudes and Longitudes
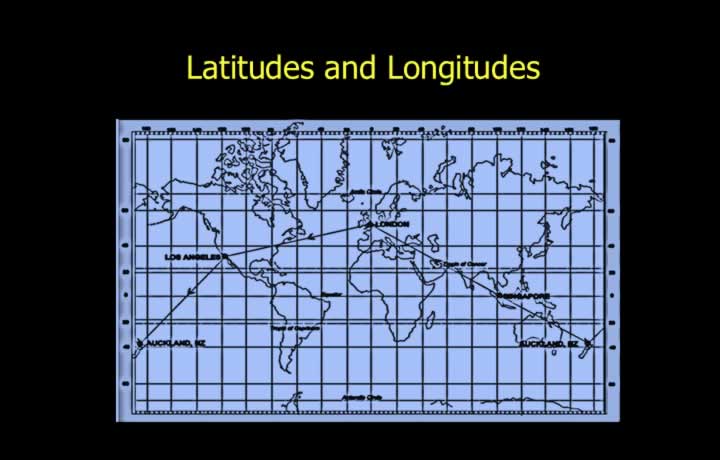
- Ideally, latitude and longitude should be easy to plot.
- This is achieved when:
- Parallels and meridians are straight lines.
- They intersect at right angles.
- Aviation charts intended for plotting should satisfy these conditions.
Fitment of Adjacent Sheets
- Adjacent chart sheets should fit together accurately.
- There should be no gaps between adjoining sheets.
- Overlap should be minimized, although small overlaps are acceptable.
Worldwide Coverage
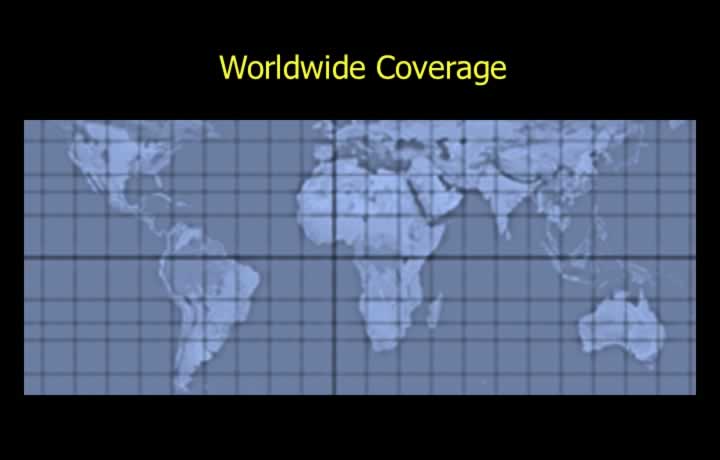
- Ideally, a single projection should be suitable for the entire world.
- In practice, no projection can satisfy this requirement.
- Different projections are used for different latitude zones.
Important Properties for Aviation Charts
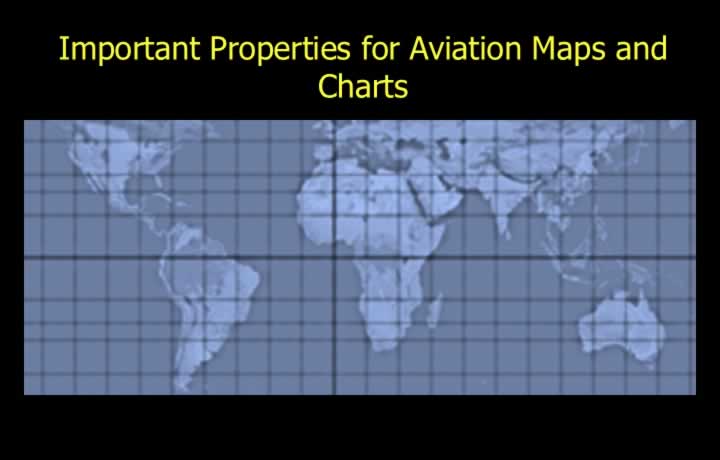
- Aviation charts should possess the most important navigation properties.
- Orthomorphism (conformality) and correct scale are essential.
- Ease of plotting is also highly important.
- Ideally, great circles should be straight lines.
- Alternatively, rhumb lines may be represented as straight lines, depending on the projection.
Ideal Chart
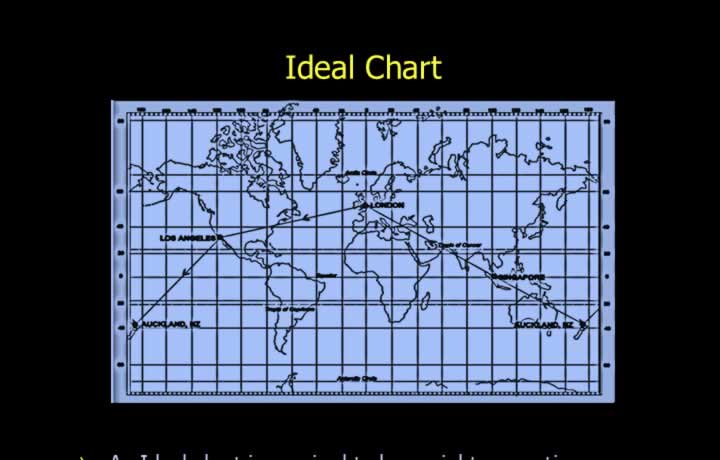
An ideal map projection should possess the following eight properties:
- The chart should be orthomorphic (conformal).
- Angles and bearings should be measured accurately.
- Scale should be both correct and constant throughout the chart.
- Shapes of features should match their true shapes on Earth.
- Equal areas on Earth should appear as equal areas on the chart.
- Rhumb lines and great circles should both be represented as straight lines.
- Latitudes and longitudes should be straight lines intersecting at right angles, making plotting easy.
- Adjacent sheets should fit together without gaps or excessive overlap, and the projection should ideally provide worldwide coverage.