Polar Stereographic Projection
The Polar Stereographic Projection is an azimuthal projection centred on the Earth’s poles. It provides accurate representation of areas near the polar regions. It is used in aviation and navigation for flights operating at high latitudes.
Azimuthal Projections
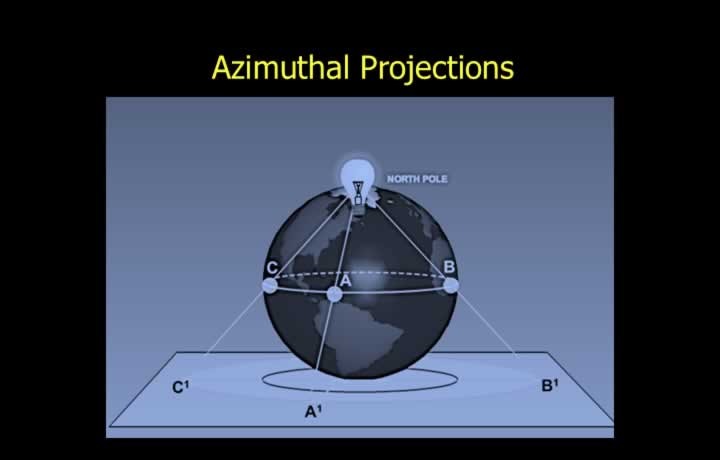
- Azimuthal projections are produced by projecting the Earth’s surface onto a flat plane.
- Since the projection surface is flat, the resulting map is circular.
- The Reduced Earth touches the plane at the pole, known as the point of tangency.
- Scale is correct only at the point of tangency and increases away from the pole.
Scale Expansion in Azimuthal Projections
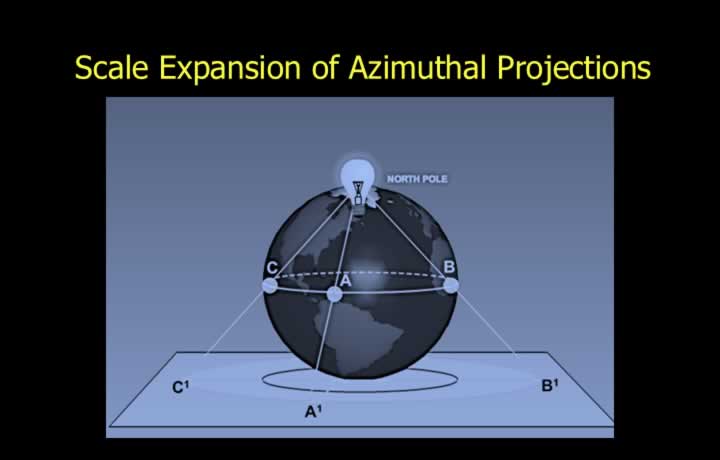
- Scale expansion is equal in all directions around a point, making the projection orthomorphic (conformal).
- Parallels of latitude are represented as concentric circles.
- Meridians are represented as radial straight lines.
- Meridians and parallels intersect at right angles, making plotting simple.
Polar Stereographic Projection (PSP)
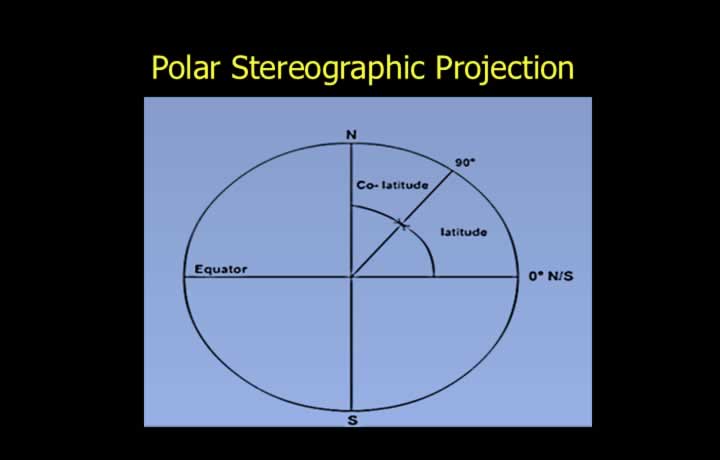
- The Polar Stereographic Projection (PSP) is a perspective, orthomorphic (conformal), azimuthal projection.
- It is an azimuthal projection because the projection surface is a flat plane.
- Unlike most perspective projections, the light source is located at the opposite pole.
- PSP is orthomorphic because scale expansion is equal in every direction around a point.
- Meridians are radial straight lines, while parallels are concentric circles.
- Meridians and parallels intersect at 90°.
Scale Expansion in the Polar Stereographic Projection
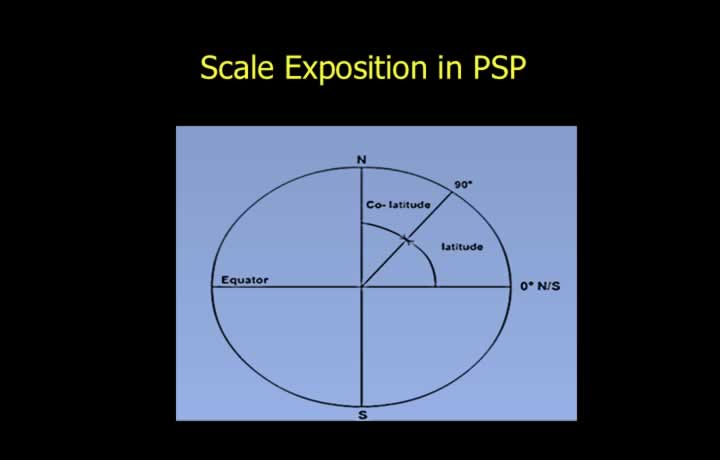
- Scale is correct at the pole, which is the point of tangency (origin).
- Scale expands progressively at lower latitudes as a function of the co-latitude.
- Scale Expansion = sec² (½ × Co-latitude)
- Co-latitude = 90° − Latitude
Uses of the Polar Stereographic Projection
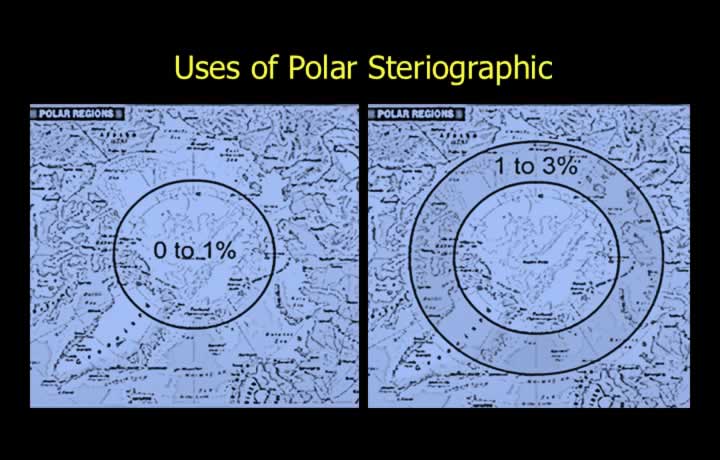
- PSP is widely used as a planning chart for an entire hemisphere.
- It is particularly suitable for polar navigation and grid charts.
- Scale error remains within 1% between 90° and 78° North or South.
- Within this region, PSP is considered a constant-scale chart.
- Accurate plotting can be carried out from the pole to approximately 78° latitude.
- Between 78° and 70° North or South, scale error remains within approximately 3%, making the projection suitable for general planning purposes.
- Shapes are most accurate at the pole and become progressively distorted farther away.
Chart Convergence
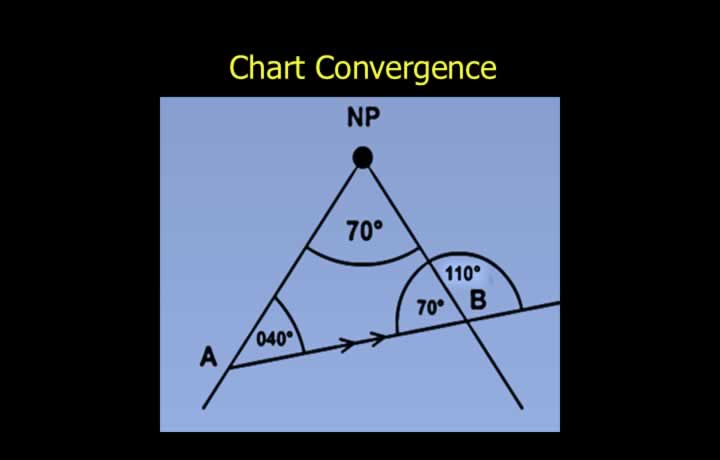
- The cone constant (chart convergence factor) is 1, the maximum possible value.
- Chart convergence is correct only at the pole.
- At all other latitudes, chart convergence is greater than Earth convergence.
- The track angle of a great circle changes by the amount of chart convergence.
- The change in great-circle track is numerically equal to the change in longitude.
Great Circles and Rhumb Lines
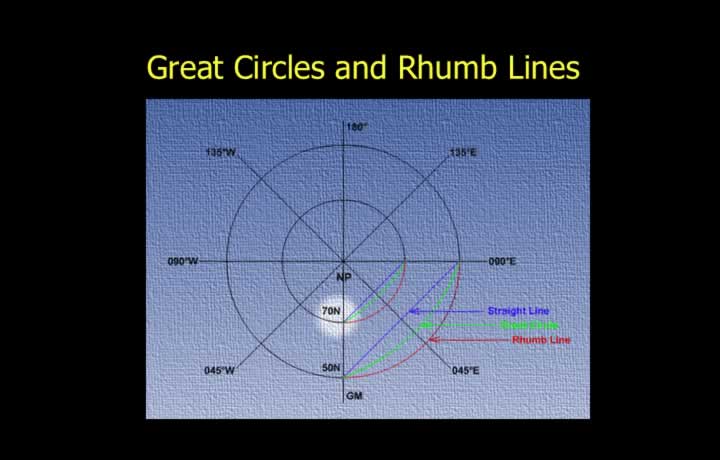
- Rhumb lines appear as curves concave toward the pole.
- Meridians are straight lines because they are also rhumb lines.
- Great circles generally appear as curves concave toward the pole, which is the point of tangency.
- Above approximately 70° latitude, a straight line closely approximates a great-circle route.